
Outline
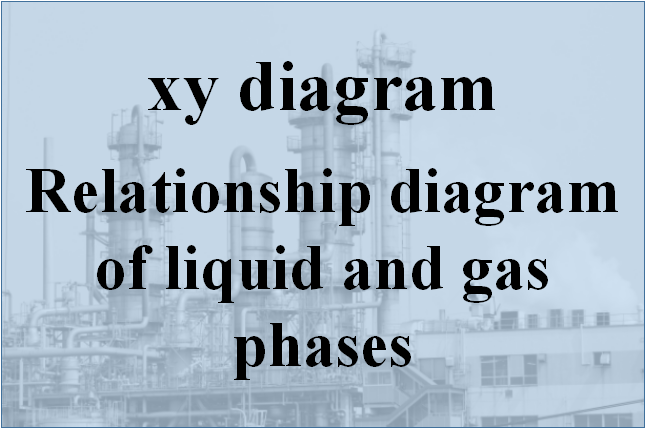
A graph that shows the vapor-liquid equilibrium relationship of two components is called an xy diagram.
As an example, the xy diagram for benzene - toluene is shown above.
It is called an xy diagram because it plots the gas-phase composition y of benzene on the vertical axis and the liquid-phase composition x of benzene on the horizontal axis.
xy diagram means that the vapor-liquid equilibrium composition of the two components at a certain temperature and pressure will be the value on the vapor-liquid equilibrium curve, and the vapor-liquid equilibrium curve is obtained and used in the design of the distillation column.
For example, in the above figure, when the benzene liquid phase composition is x = 0.50, the benzene gas phase composition is y = 0.72.
Also, since it is a two-component system, the ratio of benzene to toluene in the liquid and gas phases each adds up to 1.00.
Therefore, the toluene liquid phase composition is x = 0.50 and the toluene gas phase composition is y = 0.28.
In the above figure, we could have plotted the composition of toluene instead of benzene, but it is customary in the distillation field to plot the one with the lower boiling point of the two components. (Benzene has a lower boiling point.)
In addition, two things are usually plotted on the xy diagram.
- vapor-liquid equilibrium curve
- y=x
The reason for plotting the y=x line is that the position of this line and the vapor-liquid equilibrium curve, and whether they intersect each other or not, can help us understand the characteristics of the vapor-liquid equilibrium of the two components.
Checking the characteristics of vapor-liquid equilibrium on the xy diagram
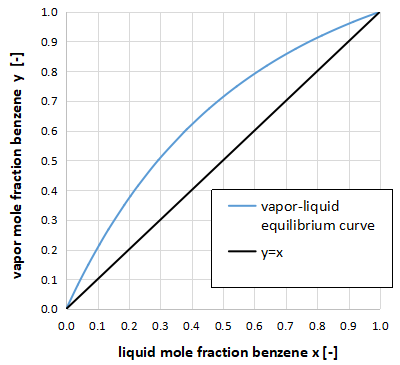
Systems that are difficult to distill and separate
For example, if the vapor-liquid equilibrium curve and the y=x line are close to each other as shown in the above figure, it indicates that the relative volatility α is small, which makes distillation separation difficult and requires a large number of column stages for separation.
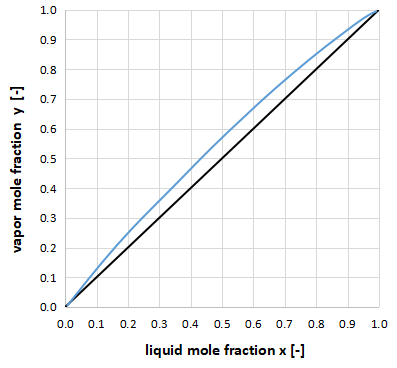
Systems that are easy to distill and separate
On the other hand, if the vapor-liquid equilibrium curve and the y=x line are far apart, as shown in the figure above, the relative volatility α is large, indicating that distillation separation is easy and the number of column stages required for separation is small.
Systems close to the ideal solution
The xy diagram can also be used to determine if the system is an ideal system that obeys Raoult's law.
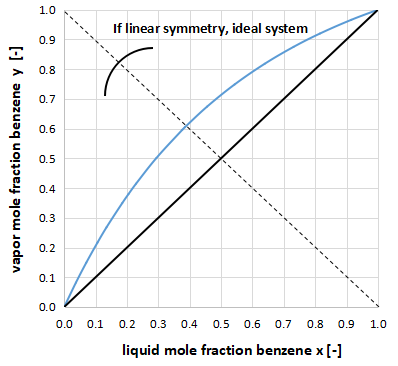
Draw a dotted line as shown in the above figure, and if the right side and left side are line symmetrical, it is close to the ideal system.
The benzene-toluene system is close to the ideal system.
Systems with azeotropic point
If the vapor-liquid equilibrium curve intersects the y=x line, the system has an azeotropic point.
In addition, you can determine the minimum or maximum azeotrope by the way these lines intersect.
Minimum azeotropic system
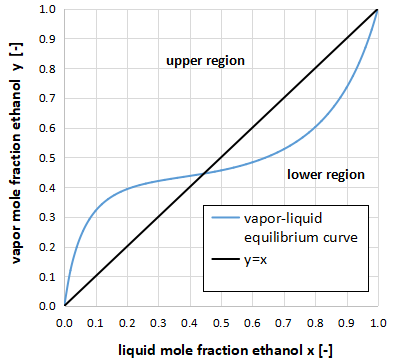
Consider a region divided vertically by y=x as shown in the above figure.
If the vapor-liquid equilibrium curve crosses from the upper region to the lower region, it is the minimum azeotropic system.
Incidentally, the above figure is the xy diagram of the two-component system of ethanol and benzene.
Maximum azeotropic system
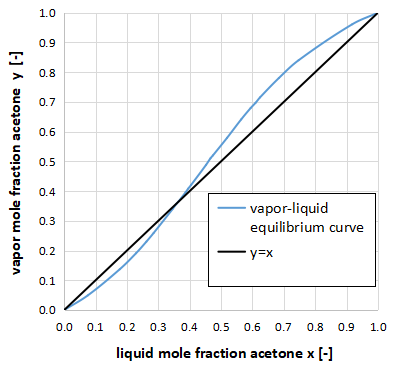
On the other hand, if the vapor-liquid equilibrium curve crosses from the region below y=x to the region above y=x, it is the maximum azeotropic system.
The above figure is an xy diagram of a two-component system of acetone-chloroform.
Two-phase separating system
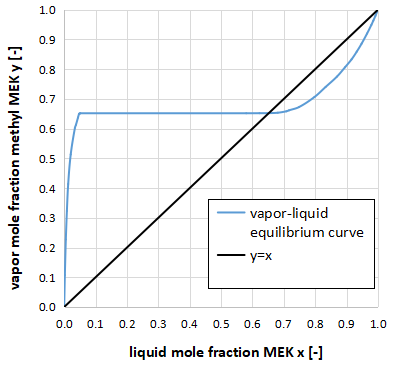
The xy diagram can also be used to determine when two liquid phases are formed.
As shown in the above figure, if the composition of the gas phase y remains constant even if the composition of the liquid phase x changes (horizontal straight line part), the liquid-liquid phase is formed.
The above figure is an xy diagram of a two-component system of methyl ethyl ketone(MEK) and water.
For your information, this two-component system has a vapor-liquid equilibrium curve that intersects y=x, so we know that it has a minimum azeotropic point.