Outline
A graph that shows the relationship between the liquid phase composition x, gas phase composition y, and temperature T for two components at a constant pressure is called a Txy diagram.

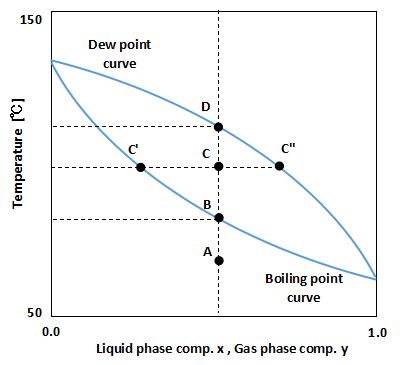
As shown in the above figure, the Txy diagram is a graph in which temperature T is plotted on the vertical axis and liquid phase composition x and gas phase composition y are plotted on the horizontal axis.
The line at the bottom of the figure is called the boiling point curve, and it represents the temperature at which the mixture begins to evaporate.
The upper line in the figure is called the dew point curve, and it represents the temperature at which the gas mixture begins to condense.
In general, lower temperatures make it easier for substances to condense into liquids, while higher temperatures make it easier for them to evaporate and become gases.
Therefore, point A is below the boiling point curve, so it is in the liquid state.
The temperature is raised from point A, and when it reaches point B, the liquid begins to evaporate.
This point B is the boiling point of the mixture at that temperature, pressure, and composition.
When the temperature is further increased to reach point C, a mixture of liquid and gas is formed.
It follows the principle of leverage to determine what composition separates a liquid from a gas.
In the above figure, the liquid phase composition is at point C' and the gas phase composition is at point C''.
When the temperature is increased further and reaches point D, the liquid is completely finished evaporating.
This point D is the dew point of the mixture at the temperature, pressure, and composition.
Thus, there is a close relationship between temperature and the state of the mixture.
Since distillation columns are generally operated at constant pressure, the Txy diagram makes it easy to consider the method of operation.
Checking the characteristics of vapor-liquid equilibrium on a Txy diagram
The characteristics of vapor-liquid equilibrium can be checked in the form of a Txy diagram.
Azeotropy
A two-component system with an azeotropic point can be easily identified by checking the Txy diagram.
Minimum azeotropy
There are two types of azeotropes, but the system that shows the minimum azeotropy is by far the most common.

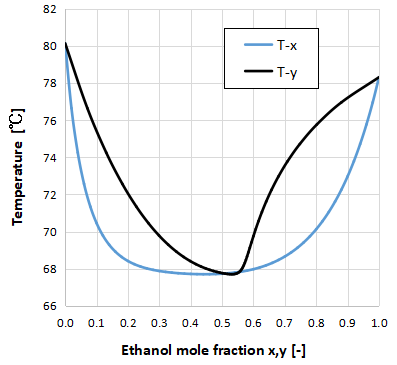
The above graph shows the Txy diagram for the two-component system of ethanol and benzene.
The minimum azeotrope is characterized by an azeotropic point that is lower than the boiling point of the pure substance of each component.
This means that it can be boiled at a lower temperature and turned into a gas. If used properly, it can reduce the energy spent on distillation and separation.
For this reason, there are distillation methods that dare to add a third component to the distillate to make it azeotropic. This method is called azeotropic distillation.
Maximum azeotropy
The system that shows the maximum azeotropy is less than the minimum azeotropy.

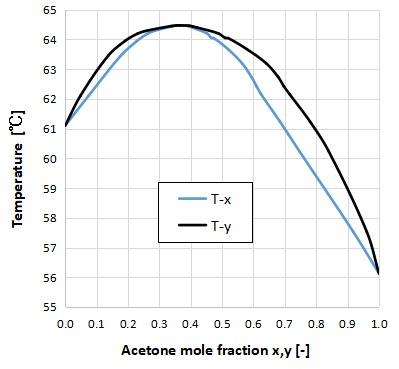
The above graph shows the Txy diagram for the two-component system of acetone-chloroform.
The maximum azeotrope is characterized by an azeotropic point higher than the boiling point of the pure substance of each component.
The Wilson model and the NRTL model, which are often used to model the activity coefficients of vapor-liquid equilibrium, cannot accurately represent the best azeotropic two-component systems, and the UNIQUAC model is considered to be a better fit.

