Outline
The measure of how easily two components can be separated by distillation is called relative volatility or specific volatility.
The relative volatility αAB is generally expressed by Eq. (1).
$$α_{AB}=\frac{K_{A}}{K_{B}}=\frac{y_{A}/x_{A}}{y_{B}/x_{B}}・・・(1)$$
KA, KB are the vapor-liquid equilibrium ratio of components A, B, yA, yB are the gas phase mole fractions of components A, B, xA, xB are the liquid phase mole fractions of components A, B.
Substituting Eq. (2) and (3) into Eq. (1) and organizing for yA, we obtain Eq. (4).
$$x_{A}+x_{B}=1・・・(2)$$
$$y_{A}+y_{B}=1・・・(3)$$
$$y_{A}=\frac{α_{AB}x_{A}}{(α_{AB}-1)x_{A}+1}・・・(4)$$
Eq. (4) is the equation for the vapor-liquid equilibrium curve in the xy diagram.
This means that if we know the relative volatility αAB, we can draw a vapor-liquid equilibrium curve.
However, since the relative volatility varies depending on the composition of the two components from Eq. (1), it is strictly necessary to calculate the relative volatility for each stage of the distillation column.
Relative volatility in ideal system
Considering an ideal solution for which Raoult's law holds, Eq. (1) can be expressed by Eq. (5):
$$α_{AB}=\frac{P_{A}}{P_{B}}・・・(5)$$
where PA, PB are the vapor pressure of component A, B.
Eq. (5) plainly means that the relative volatility is how easily component A evaporates relative to component B.
The vapor pressure of each component is generally calculated from the Antoine equation.
In the Antoine equation, vapor pressure P is a function of temperature T.
Therefore, under constant temperature conditions, the relative volatility shows a constant value.
On the other hand, under constant pressure conditions, the vapor pressure of each component changes with temperature, so the relative volatility also changes.
In this case, the geometric mean of the relative volatility, αAV, is generally used.
$$α_{av}=\sqrt{α_{A}α_{B}}・・・(6)$$
αA, αB are the relative volatility at boiling point of component A, B.
As shown in Eq. (6), the relative volatility at the boiling point of each component is used to obtain the geometric mean.
Relative volatility values and xy diagram
In equation (5), the relative volatility is usually a number greater than 1 because the numerator of the equation usually has a component with high vapor pressure.
α≈1
When the relative volatility is close to 1, the vapor pressures of the two components are almost the same and distillation separation is difficult.
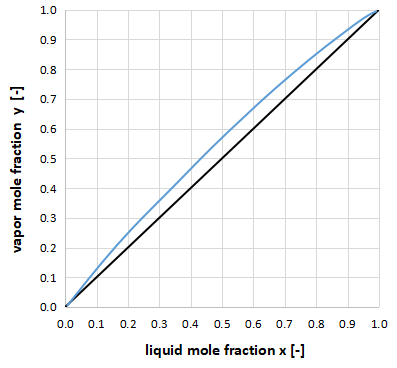
The above graph shows the xy diagram for a relative volatility close to 1.
Since the vapor-liquid equilibrium curve is close to y=x, it is clear that a large number of distillation column stages are required to achieve a distillation separation.
Realistically, it is said that if α > 1.2, it can be separated by distillation.
If 1 ≤ α ≤ 1.2, distillation is impractical because the number of steps is too large.
It is necessary to devise a way to change the relative volatility by introducing other components or changing to a different separation method.
α>>1
If the relative volatility is significantly greater than 1 by far, there is a considerable difference in vapor pressure of the two components and they are easily distillable and separated.
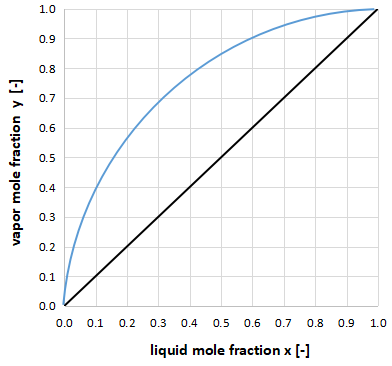
The above graph shows the xy diagram for cases where the relative volatility is overwhelmingly greater than 1.
The vapor-liquid equilibrium curve is away from y=x, indicating that distillation is easy.
In conclusion
Relative volatility, a measure of ease of distillation separation, was explained.
Before designing a distillation column, it is a good idea to check what the relative volatility will be.