
Outline
A graph that shows the relationship between liquid phase composition x, gas phase composition y, and pressure P for two components at a constant temperature is called a Pxy diagram.
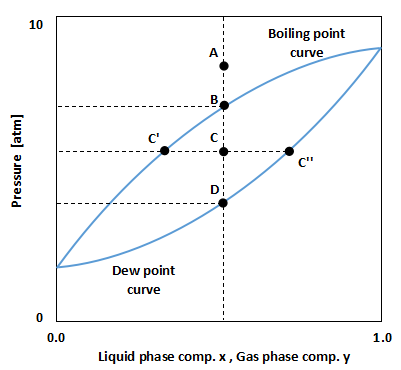
As shown in the above figure, the Pxy diagram is a graph in which the pressure P is plotted on the vertical axis and the liquid phase composition x and gas phase composition y are plotted on the horizontal axis.
The upper line in the figure is called the boiling point curve, and it represents the pressure at which the mixture begins to evaporate.
The lower line in the figure is called the dew point curve and represents the pressure at which the gas mixture begins to condense.
In general, substances are more likely to condense into liquid when the pressure is high, and evaporate into gas when the pressure is low.
Therefore, point A in the figure is above the boiling point curve, which is the liquid state.
The pressure is reduced from point A, and when it reaches point B, the liquid begins to evaporate.
This point B is the boiling point of the mixture at that pressure, temperature, and composition.
When the pressure is further reduced to reach point C, a mixture of liquid and gas is formed.
It follows the principle of leverage to determine what composition separates a liquid from a gas.
In the above figure, the liquid phase composition is at point C' and the gas phase composition is at point C''.
When the pressure is further reduced to reach point D, the liquid is completely finished evaporating.
This point D is the dew point of the mixture at that pressure, temperature, and composition.
Since there is a close relationship between the pressure and the state of the mixture, especially in a system where the pressure is changing, check the trend on the Pxy diagram.
Pxy diagram for the case of obeying Raoult's law
If the two-component system is an ideal solution that obeys Raoult's law, the boiling point curve in the Pxy diagram will be a straight line.
This is useful because you can determine if it is an ideal system just by the shape of the Pxy diagram.
This relationship can be derived from Dalton's law and Raoult's law.
By combining Dalton's law and Raoult's law, the following two equations can be established.
$$Py_{A}=x_{A}P_{A}^{o}・・・(1)$$
$$Py_{B}=x_{B}P_{B}^{o}・・・(2)$$
where P is the total pressure, Po is the vapor pressure of pure substance for each component, y is the gas phase mole fraction of each component, x is the liquid phase mole fraction of each component.
Add Eq. (1) and (2) together side by side.
$$P(y_{A}+y_{B})=x_{A}P_{A}^{o}+x_{B}P_{B}^{o}$$
Here we use the relationship between the compositions of the two components in Eq. (3) and (4).
$$y_{A}+y_{B}=1・・・(3)$$
$$x_{A}+x_{B}=1・・・(4)$$
$$P=x_{A}P_{A}^{o}+P_{B}^{o}(1-x_{A})$$
$$P=(P_{A}^{o}-P_{B}^{o})x_{A}+P_{B}^{o}・・・(5)$$
It can be transformed to Eq. (5).
Since the temperature is constant in the Pxy diagram and the formula for calculating vapor pressure, such as the Antoine equation, is a function of temperature, the vapor pressures PAo and PBo are constant in Eq. (5).
Therefore, Eq. (5) is a linear function of xA with respect to pressure P, and it is a straight line on the Pxy diagram.